Case studies.

Experimental work from Eduardo Nunes dos Santos and collaborators on measuring fluid composition, motion and displacement.

Distributed sensing

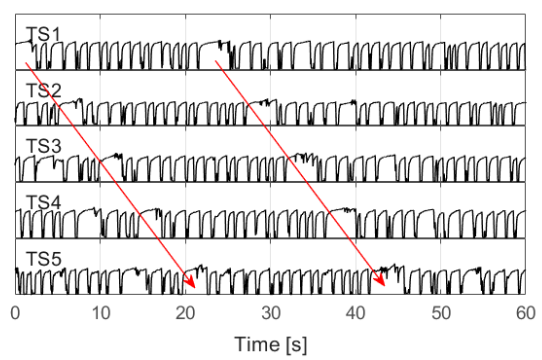
Tracking gas structures.

Paired capacitance signals reveal when a gas pocket passes and how it moves downstream in an oil–gas loop.

Explore the experiment ↗
Measured gas-fraction traces from the distributed sensing study
26 & 50mmTest pipe diameters
Optical measurement

Measuring the speed of a liquid film

How fast does the film move down the pipe wall in annular flow?

Method and findings

The team used two-dimensional phase correlation to follow ripples and disturbance waves between consecutive high-speed camera frames. The resulting velocity profiles fed a mass balance to estimate mean film thickness.

The thickness estimate differed from the conductance reference by about 5% in a 26 mm pipe and by up to 20% in a 50 mm pipe. Pipe diameter mattered when interpreting the image-based estimate.

A. L. B. Santana et al. · Experimental and Computational Multiphase Flow · 2026

Read the publication ↗
0–100g/LNaCl concentration tested
Produced-water analysis

Measuring oil in saline produced water

How much does salt affect the reported total oil and grease concentration?

Method and findings

The researchers compared gravimetric and spectrophotometric measurements across oil concentrations and salinities. Testing the same mixtures made it possible to separate method bias from changes in the sample.

At 100 g/L of NaCl, gravimetric readings overestimated oil content by up to 60%. The spectrophotometric methods were more consistent across the salinity range tested.

E. Trento Jr. et al. · Results in Engineering · 2026

Read the publication ↗
8.15mLength of the test section
Pipeline operations

Following a flushing front through a pipe

How much injected fluid is needed to displace the original contents of a horizontal line?

Method and findings

In a 26 mm test loop, water–glycerol mixtures displaced fresh water. Two resistive probes measured local concentration while a differential-pressure measurement captured the hydraulic response. The team compared the recorded front with CFD simulations.

The concentration histories showed how the displacement front moved and spread. Together with the injected volume, they allowed researchers to compare flushing efficiency at different viscosities and flow velocities.

E. Freitas et al. · International Congress of Mechanical Engineering (COBEM) · 2023

Read the publication ↗
0.0042Median mean squared error
Virtual sensing

Reconstructing liquid holdup between sensors

Can neighbouring sensors recover the time history of liquid fraction at an intermediate position?

Method and findings

The study used cross-correlation to estimate bubble propagation speed, then aligned input windows with the travel time between sensors. A deep-learning model reconstructed the intermediate liquid-holdup series, which was checked against a physical sensor.

Across 16 operating conditions, the reported median mean squared error was 0.0042 on the dimensionless holdup scale. The comparison used data from the horizontal oil–dense gas test loop.

M. P. C. Morais · Deep learning-based virtual sensing for liquid holdup time series in horizontal two-phase flow · UTFPR master’s dissertation, 2026. Co-advisor: E. N. dos Santos.